Finance

Finance gives you one private view of your money: accounts and holdings, assets and debts, monthly cash flow, and a net-worth trend that grows as you use it. You’ll find it under Personal → Finance.
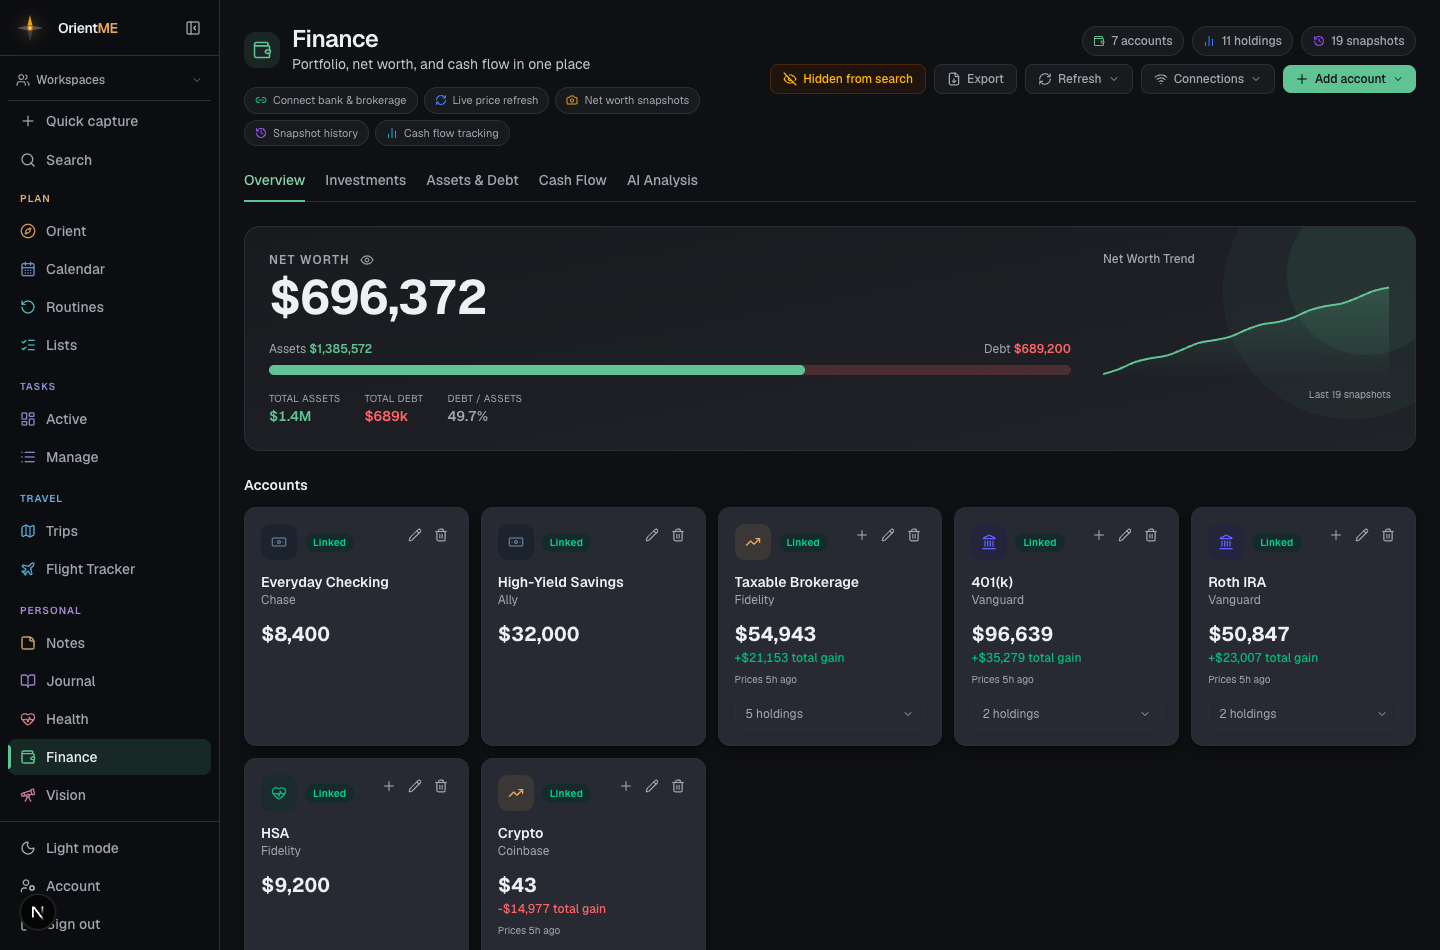
The area is organized into five tabs:
| Tab | What’s there |
|---|---|
| Overview | Net worth, accounts, holdings, and an assets-vs-debt summary |
| Investments | Just your accounts and holdings table |
| Assets & Debt | Properties and other assets, plus loans and credit cards |
| Cash Flow | Monthly income and expenses |
| AI Analysis | A plain-language AI overview of your investment holdings, plus a financial brief for a calendar quarter |
For everything about linking banks and brokerages, manual accounts, and keeping balances fresh, see Accounts & connections.
Your first visit
Before you've added anything, the Overview tab opens with two ways in — Connect an account or Track manually — along with a reminder that connections are read-only and that Finance stays out of global search until you turn that on. Connect an account links your banks, brokerages, and loans together in one step; the rest is up to you to enter by hand. Mix them freely (say, a linked bank plus a hand-entered retirement account), and the full dashboard appears as soon as your first account, asset, or debt exists.
See Accounts & connections for the full walkthrough of both ways in.
On mobile, the same first-run screen leads with Add account so you can start tracking by hand right away, plus the read-only reminder. Linking a bank happens on the web; once it's linked, everything — including your Cash Flow transactions — shows up on the app.
Net worth
The Overview tab opens with your net worth — total assets minus total debt — and an assets-vs-debt bar. As you record snapshots over time, a net-worth trend chart appears (it needs at least two snapshots before it shows).
Working in public? Click the eye toggle on the net-worth banner to hide every dollar
figure across Finance — account balances, holdings and share counts, transactions, and even a
trip's spending panel show •••••• until you toggle back. AI analysis (which is written text
with your real numbers in it) hides behind a placeholder. The setting is remembered per device,
so your laptop can stay discreet while your home devices show everything. Works the same on
mobile.
How the tabs fit together
The Overview tab is the dashboard — it pulls the highlights from every other tab into one place: your net worth, your accounts and holdings, and an assets-vs-debt summary. To dig into any one part, move to its dedicated tab:
- Investments — your accounts and the full holdings table, with live prices and a portfolio allocation donut.
- Assets & Debt — properties, vehicles, and other valuables on one side; mortgages, loans, and credit cards on the other.
- Cash Flow — month-by-month income and expenses, built by hand or from your bank activity.
- AI Analysis — a plain-language overview of your holdings plus an exportable quarterly financial brief.
Finance on your dashboard
The Today page carries a Finance card with your net worth, this month's cash in and out, and — whenever a credit card is carrying a balance — a Credit cards line showing what's owed right now. The card respects the same eye toggle that hides amounts across the app, and shows an "Updated" stamp so you know how fresh the numbers are. Opening Today also quietly refreshes your linked accounts in the background when they're due — the same once-a-day rhythm as opening the Finance page, governed by the same Auto-sync on open setting.
Snapshots, export, and privacy
- Snapshots — each time you refresh your balances or prices from the header Refresh menu, OrientME records a point-in-time net-worth snapshot (one per day). That history is what powers the trend chart.
- Export — download a JSON backup of your accounts, assets, debts, and net-worth history.
- Hidden from search — toggle whether finance data appears in global search.
Delete all finance data (in the Connections menu) permanently removes every account, holding, asset, debt, cash-flow entry, and snapshot, and disconnects any linked banks or brokerages. Export first if you want a copy — this can’t be undone.